Due to scheduled maintenance, our website may be down at some points on Sunday, June 15, 2025. Please plan accordingly. We apologize for any inconvenience.

Track proficiency performance using API DataDashboard

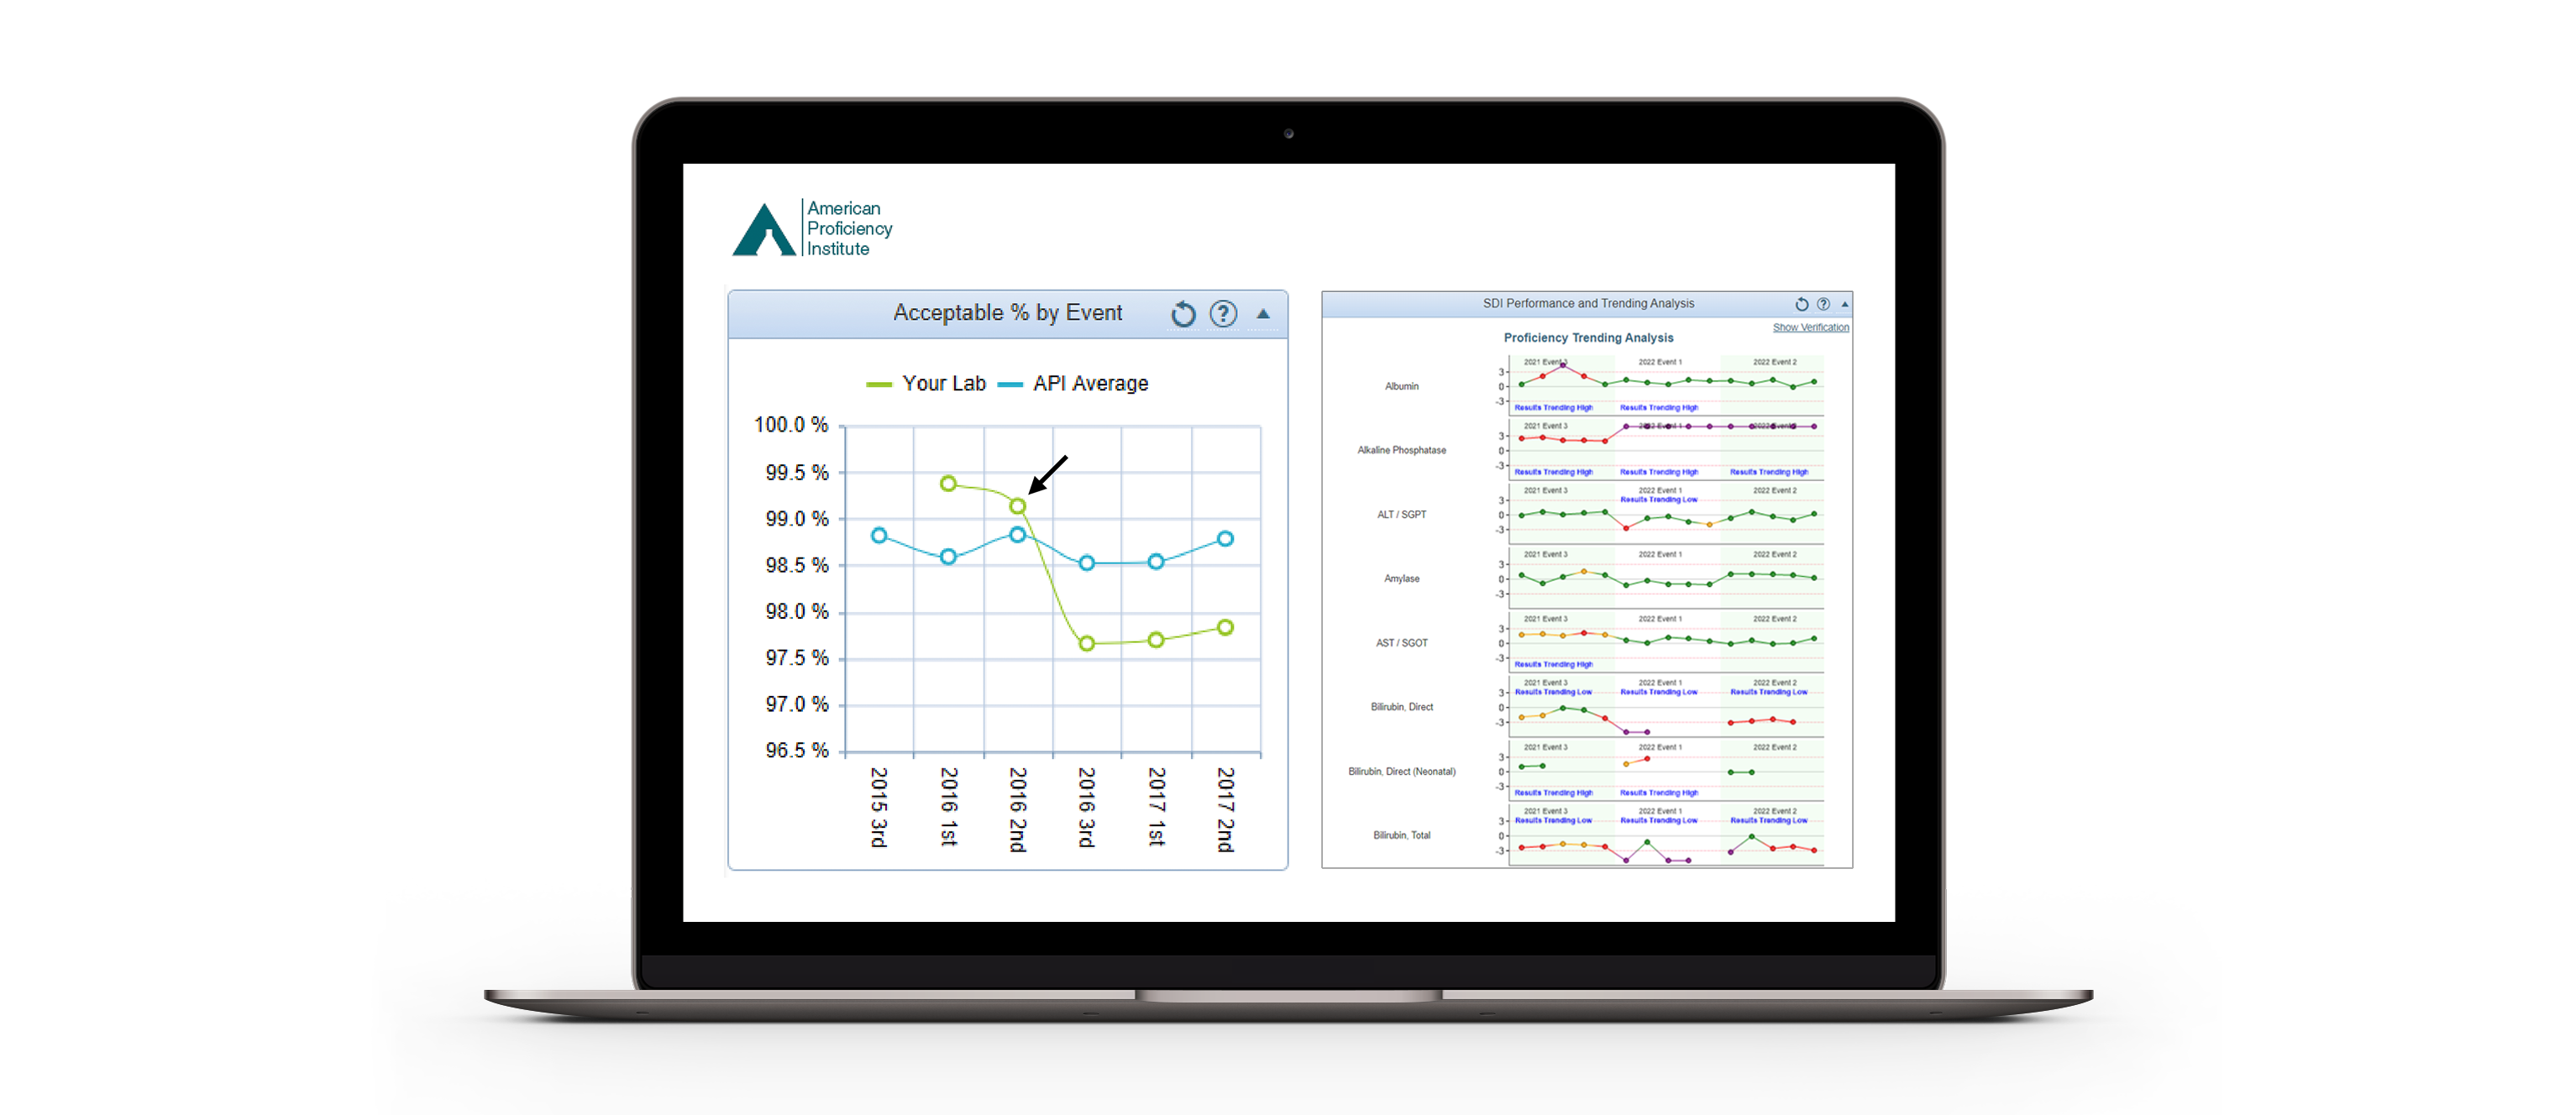
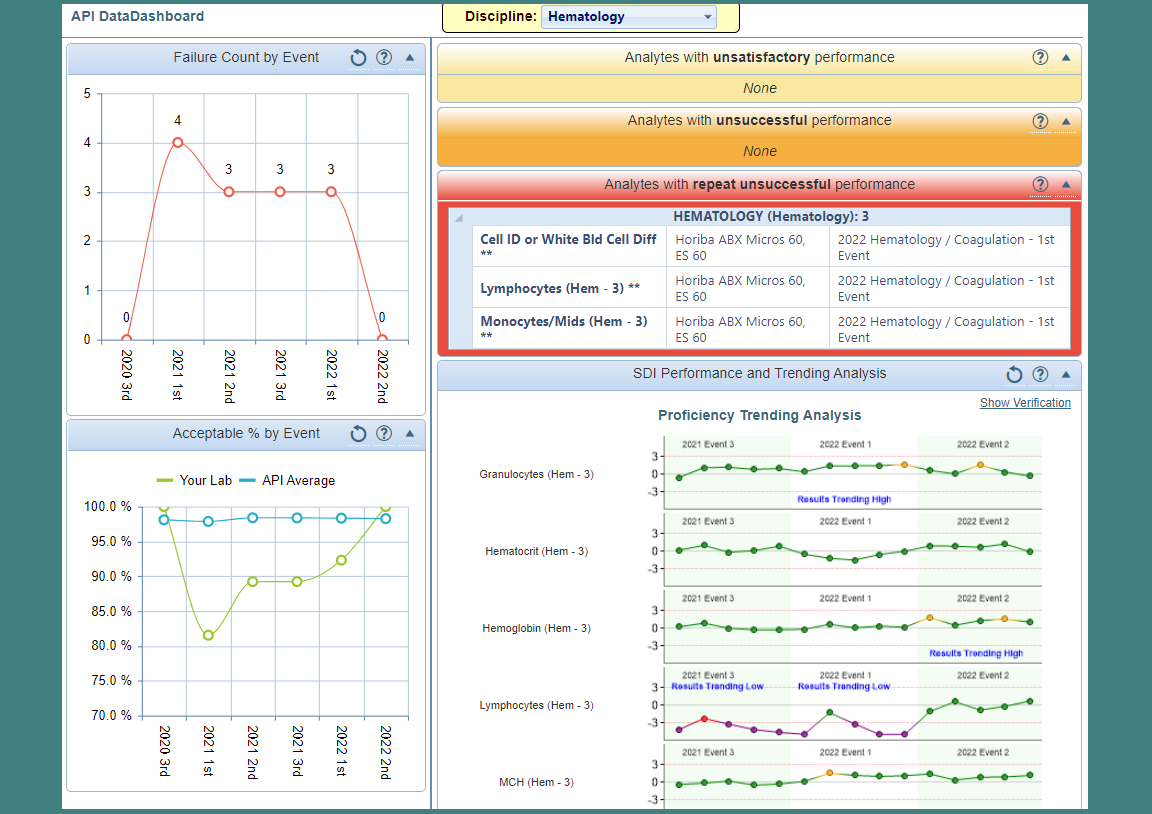
The dashboard includes trend data by analyte, percentage of acceptable results compared to all API labs, failure count by test event, and analytes with unsatisfactory performance.

Customers can log in to their API Paperless PT account to access their dashboard.

Track proficiency performance using API DataDashboard

API's DataDashboard offers laboratories a comprehensive and user-friendly solution for analyzing proficiency performance across the past 12 test events. With this free tool, users can efficiently track their proficiency testing results, identify trends, and make data-driven decisions to enhance laboratory performance

  • Prepare for accreditation inspections by identifying deficiencies or areas that require improvement

  • Aquire benchmarking data

  • Streamline troubleshooting and subsequent corrective action measures

  • Flag a problem with an analyte before a failure occurs

Customize Your PT Data

With DataDashboard you can export evaluation and performance data into Excel, allowing you to tailor how you view, organize, and present proficiency data.

This feature is a valuable tool for laboratories tracking failures, quality management personnel, and those managing multiple sites.